Product Update: Won Deal Analysis and Team Activity Dashboard
Learn why you're winning with AI-powered won deal analysis, track team performance with the new activity dashboard, and get deeper insights into custom property usage.

Learn From Every Win
Won Deal Analysis is now available in Playground for Pro customers. Instead of guessing why deals closed, get AI-powered insights into what actually drove success.
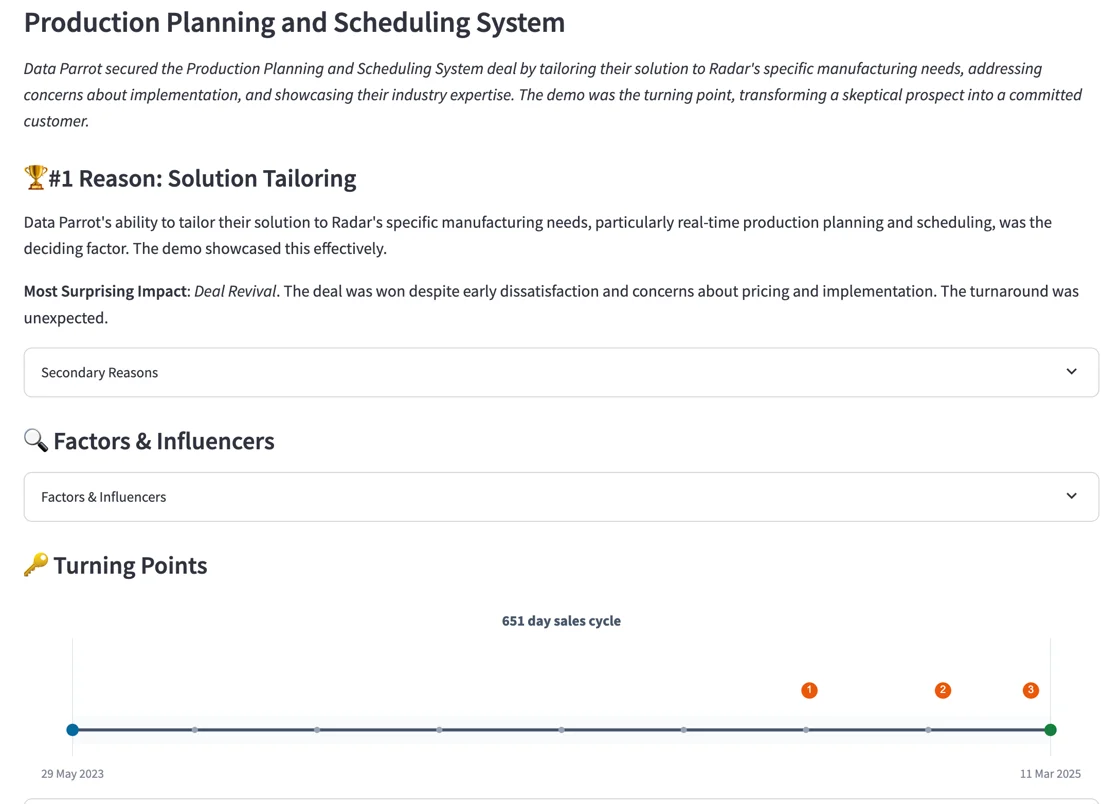
Understand Why You Won
The AI analyzes up to 10 recent wins to reveal:
Reasons for Winning: The specific factors that led to success - was it product fit, pricing, relationship strength, or timing?
Deal Factors and Influencers: Who championed the deal internally? Which stakeholders drove the decision? What external factors played a role?
Key Turning Points: The exact moments when deals shifted in your favor. Maybe it was a specific demo, a competitor stumble, or a well-timed executive meeting.
Improvement Opportunities: Even in wins, there are lessons. See where you could have moved faster, addressed concerns earlier, or avoided near-misses.
Critical Deal Signals: Patterns that predicted the win - engagement levels, stakeholder involvement, or specific behaviors that correlate with success.
Apply Lessons Forward
Use these insights to:
- Train new reps on what actually works
- Refine your sales playbook based on real wins
- Identify which deal signals to watch for
- Replicate successful patterns across the team
The analysis updates as new deals close, giving you fresh insights continuously.
Team Activity Dashboard Goes Live
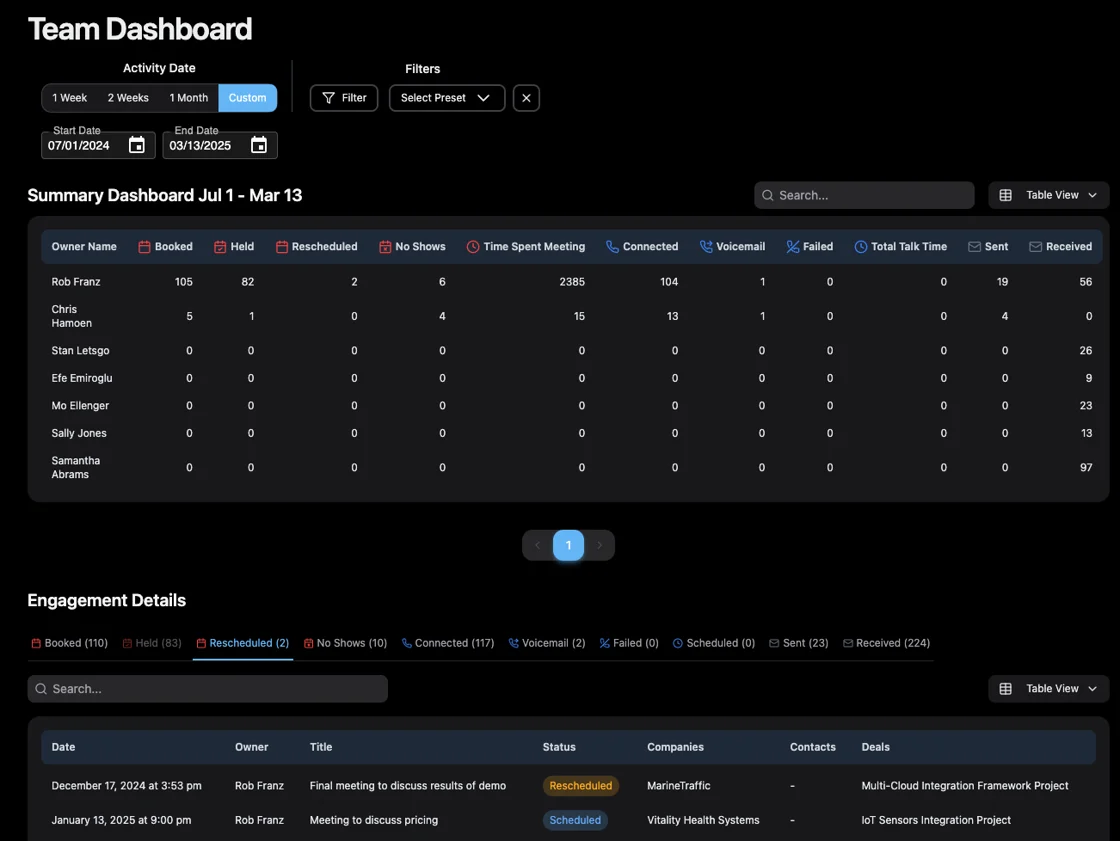
After successful testing in Playground, the Team Activity Dashboard is now available in the main app. Finally see what your team is actually doing, not just what they say they're doing.
Complete Activity Picture
Track metrics that matter:
- Meetings Booked vs Held: See show rates by rep and team
- Rescheduled Meetings: Identify deals that keep slipping
- Call Connect Rates: Understand actual conversation volume
- Email Engagement: Track send and response patterns
- Time Investment: See where reps spend their hours
Filter for Insights
Slice the data any way you need:
- By date range for trend analysis
- By pipeline to understand segment differences
- By deal owner for individual performance
- By team for group comparisons
The dashboard reveals patterns impossible to spot in HubSpot, like which reps consistently get meetings rescheduled or which teams have the best show rates.
Home Currency Support Everywhere
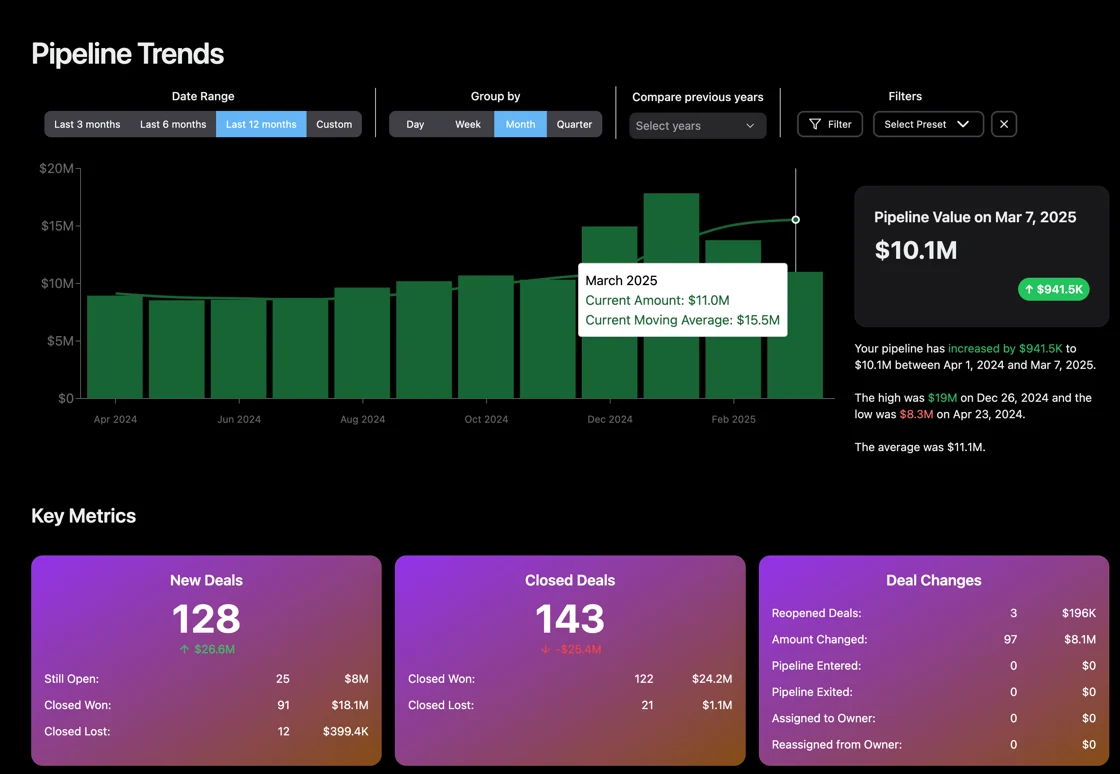
All amounts throughout Data Parrot now display in your home currency with proper symbols. No more mental conversions or confusion about which currency you're viewing.
This update affects:
- Pipeline Trends
- AI Forecast
- Deal Pulse
- All export files
- Email notifications
Multi-currency deals automatically convert to your home currency for consistent reporting and analysis.
Custom Property Intelligence Expands
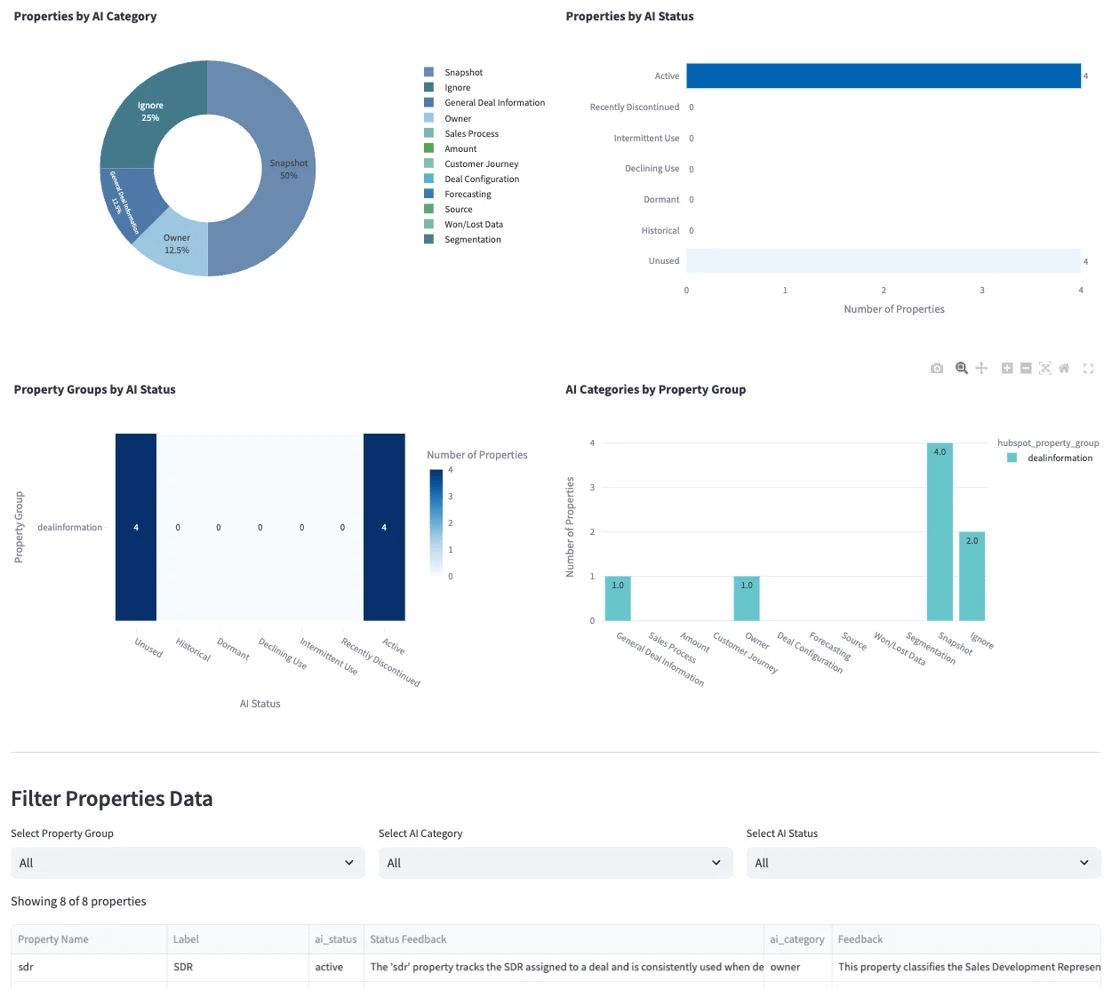
Custom property analysis now includes detailed usage analytics, showing not just what properties exist but how they're actually used.
Usage Insights
For each custom property, see:
- Fill rates across deals
- Update frequency and patterns
- Team adoption levels
- Value distribution graphs
RevOps Gold Mine
The analysis helps RevOps teams:
- Identify unused properties to clean up
- Find inconsistently used fields needing training
- Discover properties that should be required
- Spot opportunities for automation
Export for Action
Export the complete custom property metadata including:
- AI-generated descriptions
- Usage statistics
- Category classifications
- Improvement recommendations
Use this data to justify property cleanup projects or standardization initiatives.
Enhanced Deal Pulse Visualization
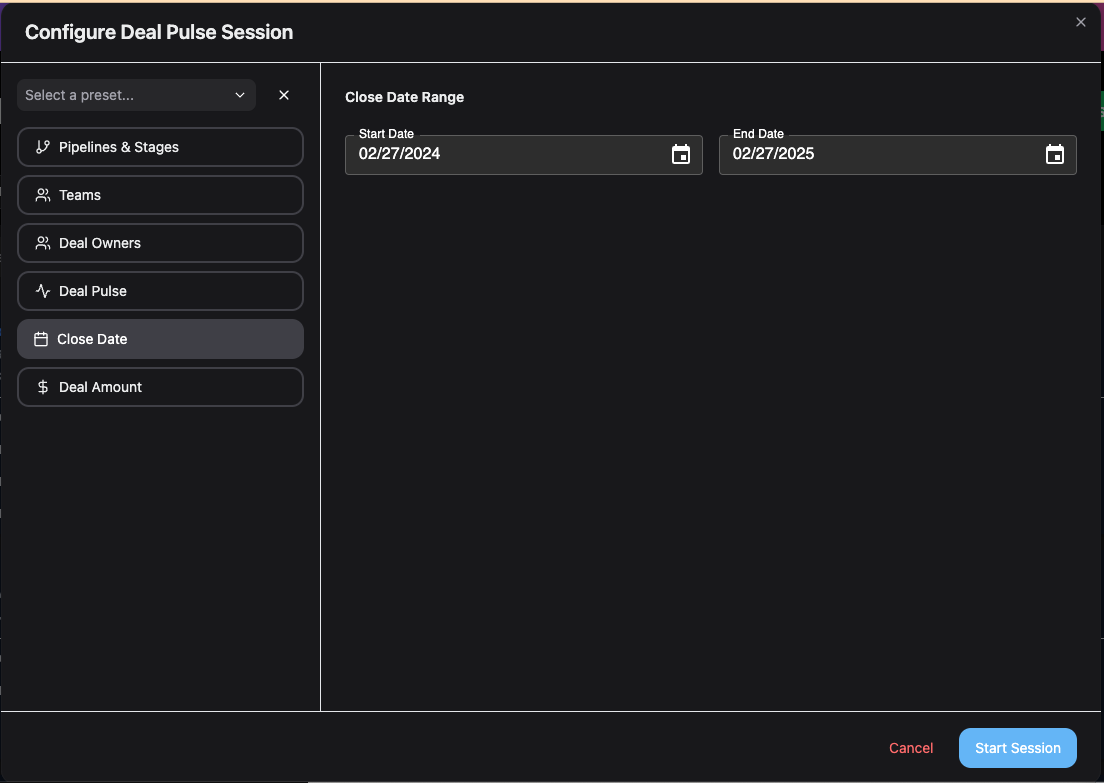
Deal Pulse Mode now visualizes filtered amounts in a bar chart when you filter by close date. See your pipeline distribution across time periods instantly.
The chart helps you:
- Spot pipeline gaps before they become problems
- Balance deal flow across months
- Identify quarters needing more coverage
- Visualize the impact of deal movements
Combined with amount range filtering, you can now run incredibly targeted deal reviews focused on specific segments and time periods.
Additional Updates
Research Trends Deal Owner Filter: Filter Research Trends by specific deal owners to understand individual rep patterns and customer feedback.
Last Sync Visibility: See exactly when Data Parrot last pushed AI properties to HubSpot, ensuring you always know how current your CRM data is.
Getting Started
Won Deal Analysis: Pro customers can access this through Playground. Review your recent wins to understand success patterns.
Team Activity Dashboard: Now in the main navigation. Start with a weekly view to understand current performance.
Custom Property Analysis: Available in Playground with enhanced usage metrics. Export the data to plan your cleanup project.
Deal Pulse Enhancements: The visualization updates automatically when you apply close date filters.
These features work together to give you unprecedented visibility into what drives success. Won Deal Analysis shows why you win, Team Activity tracks the behaviors that matter, and Custom Properties ensure you're capturing the right data to replicate success.
About the Author
Data Parrot Team
The Data Parrot Team
The Data Parrot team is dedicated to building the most advanced AI-powered sales intelligence platform. We're a group of engineers, data scientists, and revenue operations experts passionate about helping sales teams succeed.