Product Update: Deal Stage Filtering and Historical Pipeline Comparisons
Filter deals by stage with our unified filter interface, plus compare your current pipeline against previous years to spot patterns and trends.

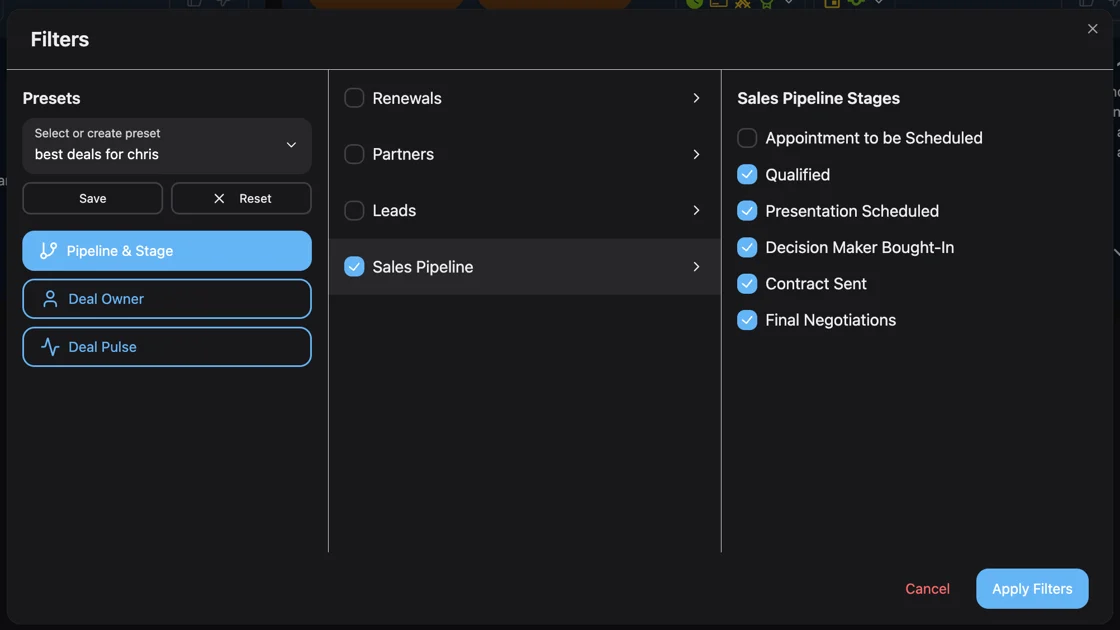
Deal Stage Filtering Returns
We brought back deal stage filtering based on your feedback, and made it better than before. Now you can focus on specific stages of your sales process to understand exactly where deals stand.
Unified Filter Interface
Everything in One Place
All filters now live in a single, unified interface. No more jumping between different menus or screens to set up your view. Deal stage filtering joins:
- Deal health scores
- Forecast categories
- Deal status
- Purchase intent
- Close dates
Mix and match any combination to create the exact view you need.
Save Complex Filter Combinations
Building the same filters repeatedly wastes time. Now you can save any filter combination as a preset:
- "Early stage deals needing attention"
- "Late stage high-intent opportunities"
- "Negotiation stage deals closing this month"
Your saved presets appear at the top of the filter menu for one-click access.
Stage-Specific Analysis
Filter by stage to answer critical questions:
- Which discovery calls are converting to demos?
- How many deals are stuck in negotiation?
- What's the average time in each stage?
- Which stages have the highest drop-off rates?
The stage filter works across Deal Pulse and AI Forecast, maintaining consistency in your analysis.
Compare Against Previous Years
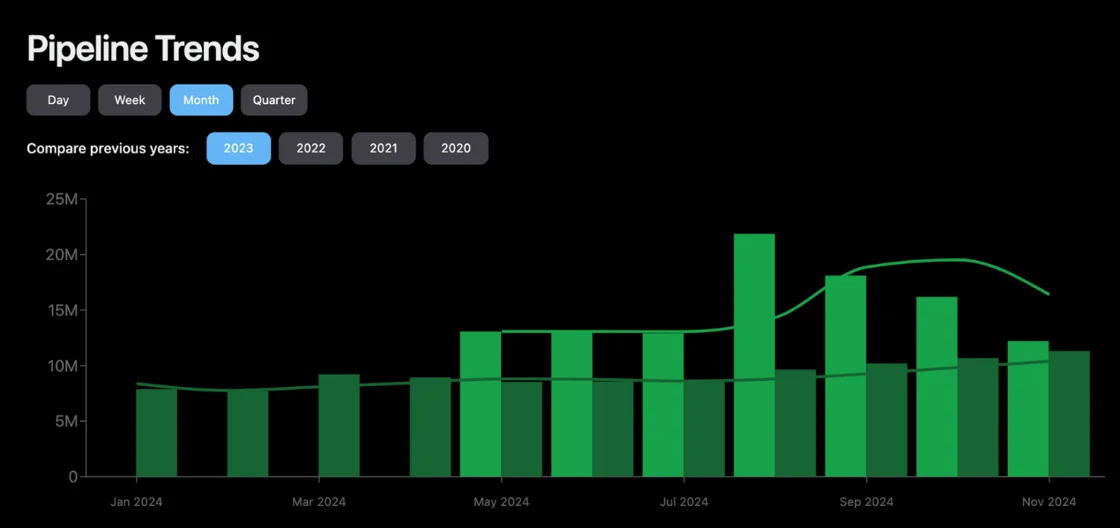
Pipeline Trends now shows historical overlays, letting you compare your current pipeline against previous years. This reveals seasonal patterns and helps you understand if you're ahead or behind historical performance.
How It Works
Click any previous year in the Pipeline Trends view to overlay it on your current data. The historical line appears in a different color, making comparisons immediate and visual.
The comparison respects all your active filters:
- Filter by specific deal owners to see individual performance trends
- Select certain pipelines to compare segment growth
- Use create date filters to analyze cohort performance
Spot Patterns and Anomalies
Historical comparisons help you:
- Identify seasonal trends in your pipeline
- Recognize if current performance is typical or exceptional
- Plan better based on historical patterns
- Set realistic targets grounded in past performance
If Q4 always sees a pipeline surge, you'll know whether this year's growth is on track. If summer typically slows down, you can plan accordingly.
Smart Filter Persistence
Your last-used filters now persist between sessions. When you return to Data Parrot, your previous view is ready and waiting. Change filters when you need a different perspective, but your default view stays consistent.
This works especially well with saved presets. Set up your Monday morning review filters once, save them, and they're ready every week.
Getting the Most from These Features
Start by exploring deal stage filtering to understand your pipeline flow. Create a few saved presets for your most common analysis needs. Then use historical comparisons to put current performance in context.
The combination is powerful: filter to show negotiation-stage deals, then overlay last year's data to see if you have more or fewer deals at this critical stage compared to the same time last year.
All features are live in your account now. The interface updates automatically, and your existing filters continue to work with the new unified system.
About the Author

Data Parrot Team
The Data Parrot Team
The Data Parrot team is dedicated to building the most advanced AI-powered sales intelligence platform. We're a group of engineers, data scientists, and revenue operations experts passionate about helping sales teams succeed.