Product Update: Pipeline Trends Redesign and Data Parrot Wrapped
Pipeline Trends gets a cleaner interface with filters at the top, plus Data Parrot Wrapped gives you AI-powered insights into your 2024 sales performance.

Pipeline Trends Gets More Intuitive
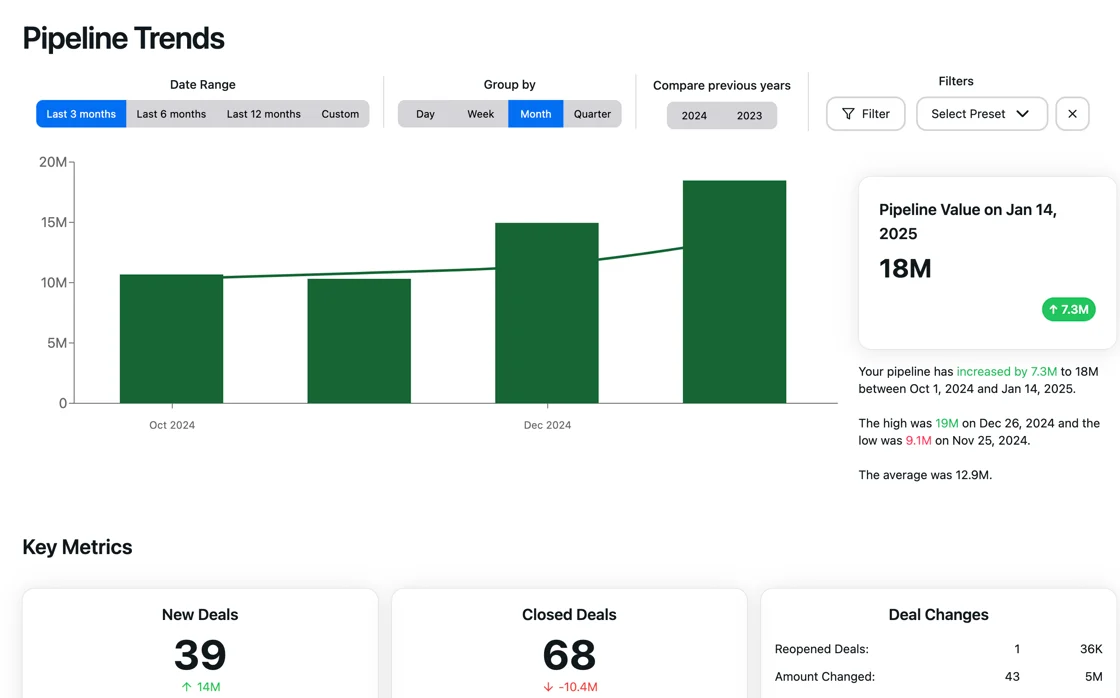
We redesigned the Pipeline Trends interface based on how teams actually use it. All controls now sit above the chart where you expect them, making analysis faster and more natural.

Everything Where You Need It
The new layout puts all controls at the top:
- Date Range selector for choosing your analysis period
- Group By options to segment your data
- Previous Years comparison toggles
- Filter controls for drilling into specific data
No more scrolling to find settings. Everything you need to analyze pipeline growth lives in one logical place above the visualization.
Faster Analysis Workflow
The reorganized interface matches how you think about data:
- First, select your date range
- Choose how to group the data
- Add comparison years if needed
- Apply filters to focus your view
This natural flow means less clicking and more time understanding what your pipeline is telling you.
Data Parrot Wrapped: Your 2024 Year in Review

Data Parrot Wrapped uses AI to analyze your entire 2024 and surface insights you'd never find manually. It's not just numbers - it's the story of your sales year.
Discover Your Pipeline Hero
Find out who really drove pipeline growth in 2024. The AI analyzes deal creation, progression, and value to identify your true pipeline champion. It's often not who you'd expect.
Understand Win/Loss Patterns
The AI identifies the key differences between won and lost deals:
- Common threads in successful deals
- Red flags that predicted losses
- Patterns you can use to improve 2025 performance
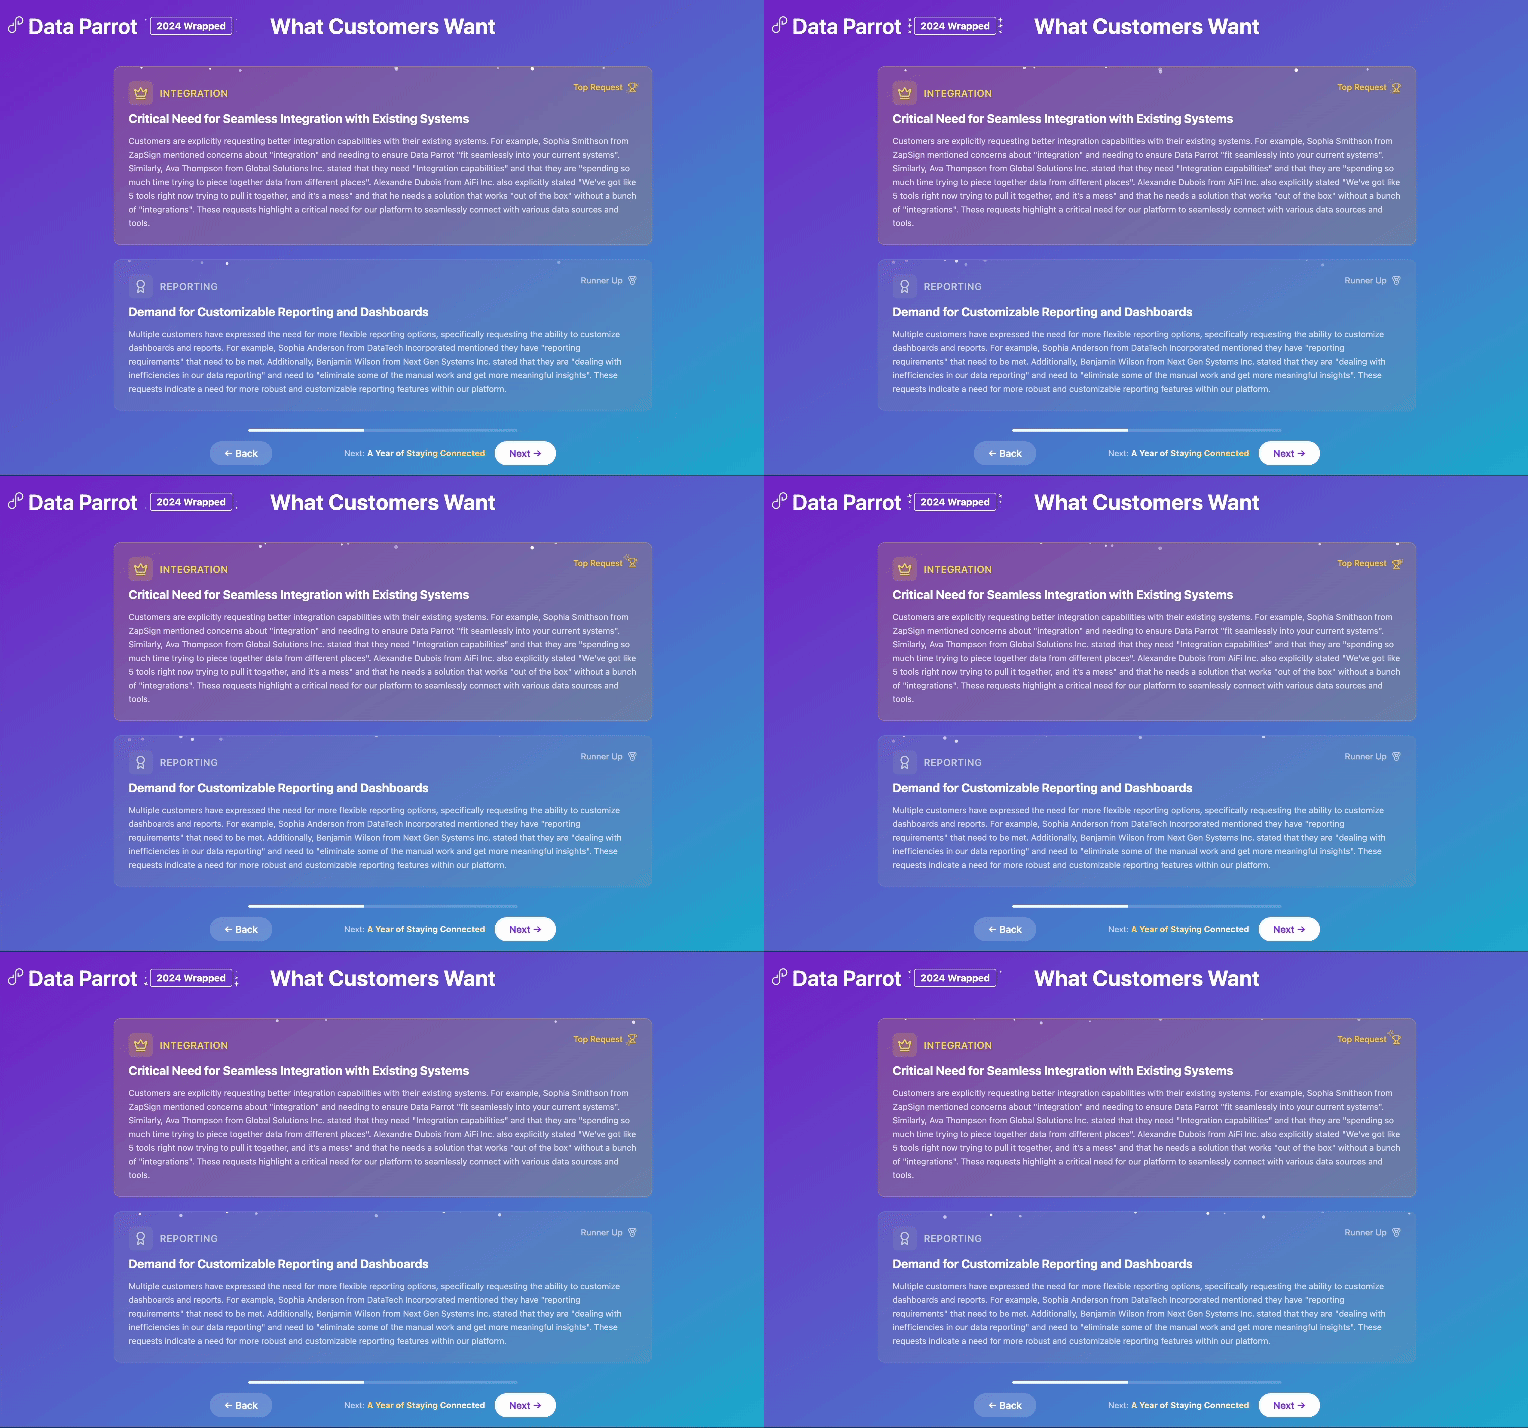
Surface Customer Trends
See what your customers actually asked for most in 2024. The AI analyzes all customer communications to identify:
- Top feature requests
- Common objections
- Emerging needs you might have missed
Spotlight Top Performers
Recognition based on real activity data:
- Who sent the most effective emails
- Which rep led the most productive meetings
- Who made the calls that moved deals forward
Positive and Negative Trend Analysis
The AI identifies trends that correlate with deal success:
- Positive trends: Activities and behaviors that lead to wins
- Negative trends: Warning signs that predict deal failure
- Actionable insights: Specific changes to implement in 2025
Using These Insights
Pipeline Trends for Planning
Use the improved Pipeline Trends interface to:
- Compare Q1 2025 pipeline build against Q1 2024
- Filter by rep to identify who needs coaching
- Group by segment to see where growth is coming from
- Overlay multiple years to spot seasonal patterns
Wrapped for Strategy
Your 2024 Wrapped insights inform 2025 strategy:
- Replicate what your Pipeline Hero did successfully
- Train the team on patterns from won deals
- Address the customer requests that appeared most frequently
- Recognize and reward your top activity performers
Access Your Features
Pipeline Trends: The new interface is already live. Just navigate to Pipeline Trends and you'll see the redesigned layout with all controls at the top.
Data Parrot Wrapped: Available now through the end of January. Access it from your Data Parrot homepage or through the direct link in the app navigation.
Both features work with your existing data - no setup required. The Pipeline Trends update maintains all your saved filters and presets, they just work better now.
Take a few minutes to explore your Wrapped insights. The patterns the AI found in your 2024 data could change how you approach 2025.
About the Author
Data Parrot Team
The Data Parrot Team
The Data Parrot team is dedicated to building the most advanced AI-powered sales intelligence platform. We're a group of engineers, data scientists, and revenue operations experts passionate about helping sales teams succeed.