Product Update: Activity Dashboard and Deal Pulse Help Overlay
Get comprehensive team activity insights with dynamic filtering and sorting, plus an interactive help overlay makes Deal Pulse Mode easier to master.

Complete Activity Visibility in One View
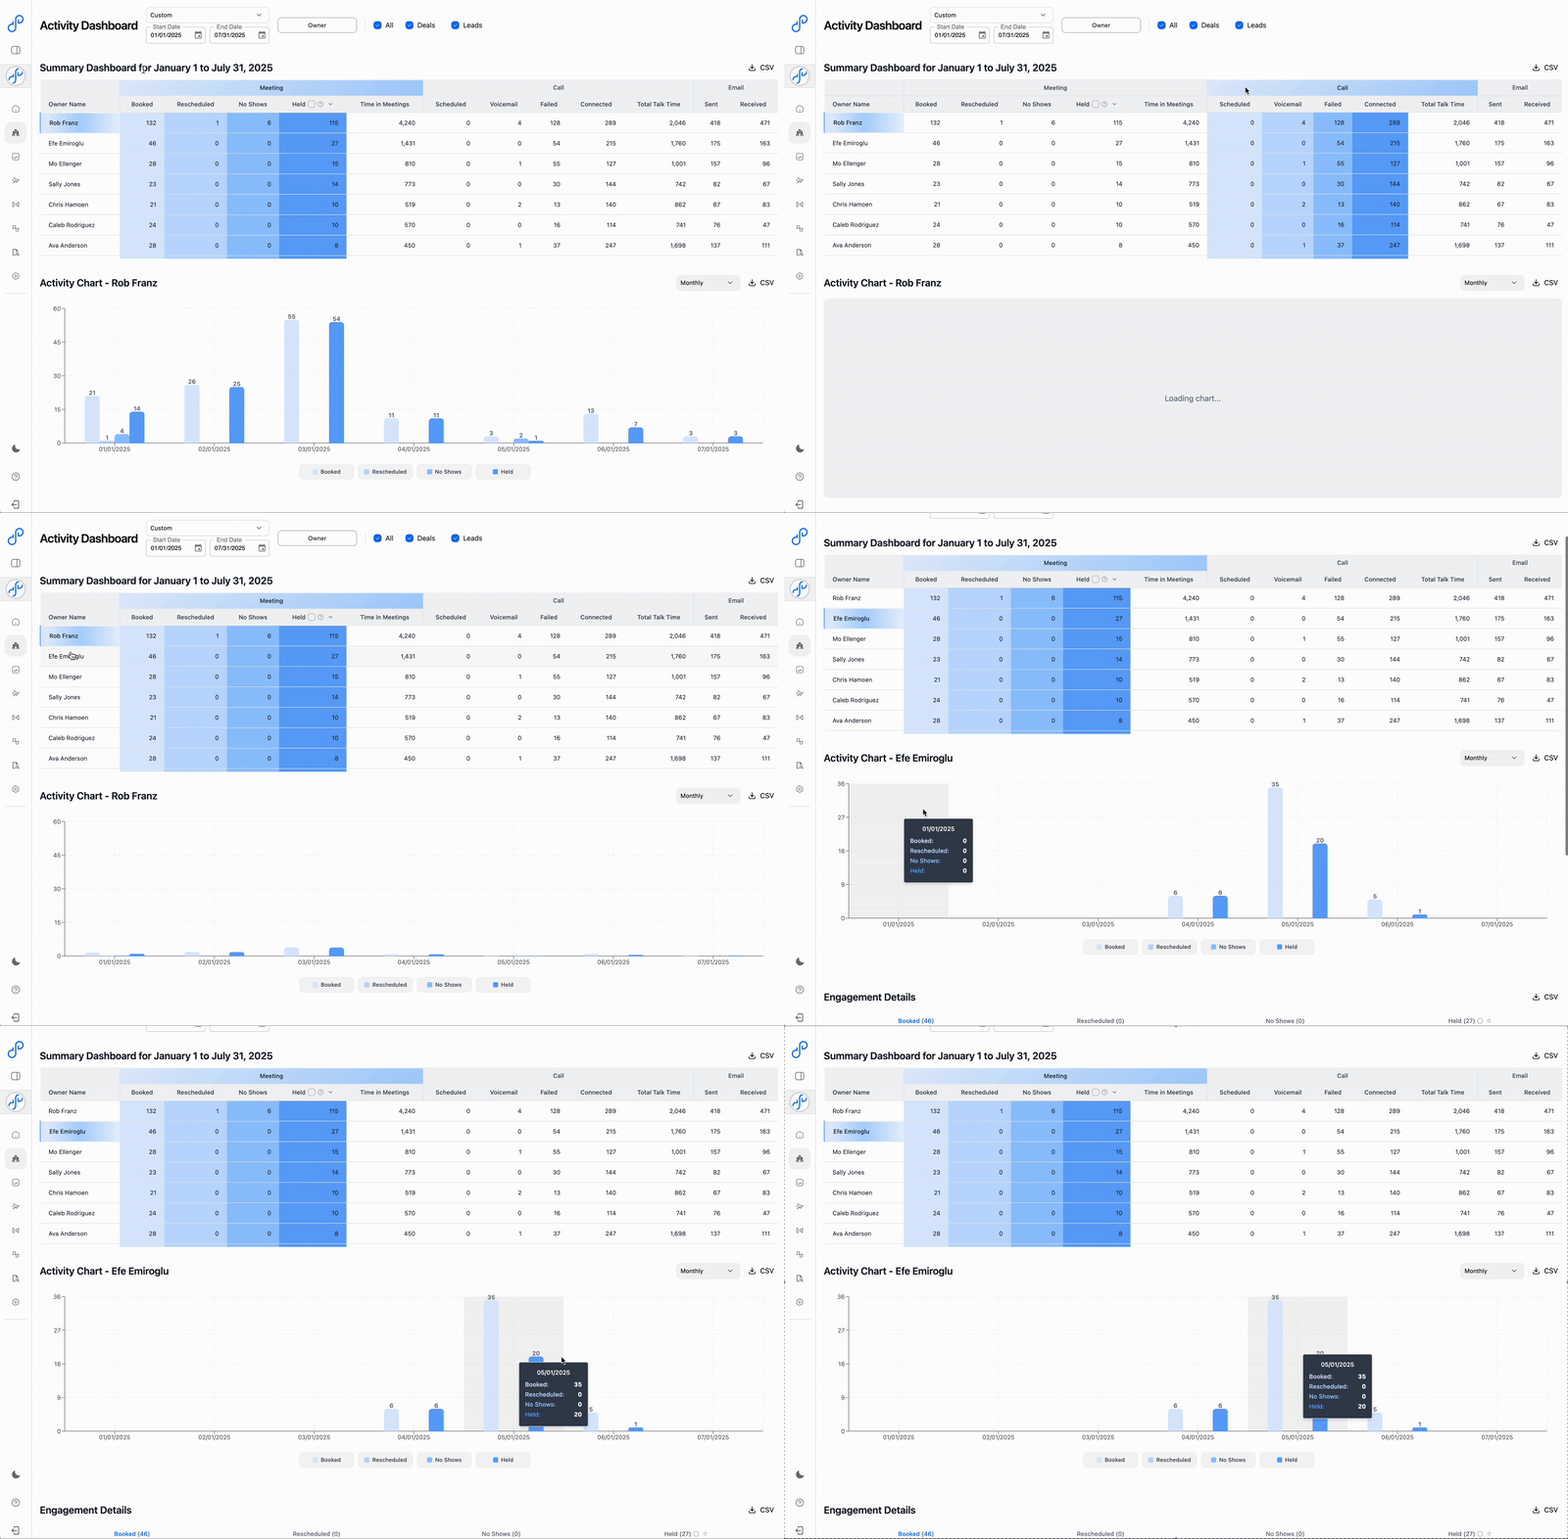
The new Activity Dashboard brings all your team's sales activities into a single, powerful interface. No more jumping between reports to understand what your team is doing.

Everything in One Place
The dashboard combines three key views:
- Summary table showing activity metrics per rep
- Trend chart visualizing engagement patterns over time
- Engagement list with detailed activity records
This unified view helps you instantly understand both the quantity and quality of team activities.
Dynamic Filtering That Responds
Click anywhere to filter everything:
- Click a rep's name to see only their activities
- Click Meetings, Calls, or Emails in headers to filter by type
- Select date ranges to analyze specific periods
- Filter by association to separate deal vs lead activities
Every click updates all three views simultaneously, making exploration intuitive and fast.
Sort Any Metric
Sort columns to find what matters:
- Meetings booked vs meetings held
- Rescheduled meetings to spot slipping deals
- Call connects and talk time
- Email volume and response rates
Quickly identify top performers, coaching opportunities, and activity gaps.
Flexible Time Grouping
View trends by:
- Day for detailed activity patterns
- Week for standard performance reviews
- Month for longer-term trends
The chart adapts to show the most relevant view for your selected timeframe.
Smart Data Cleaning
The dashboard automatically:
- Removes internal emails from counts
- Identifies duplicate meetings from multiple tools
- Filters non-sales activities
- Excludes test data
Toggle duplicate meeting visibility to see both raw and cleaned data when needed.
Deal Pulse Mode Gets Interactive Help

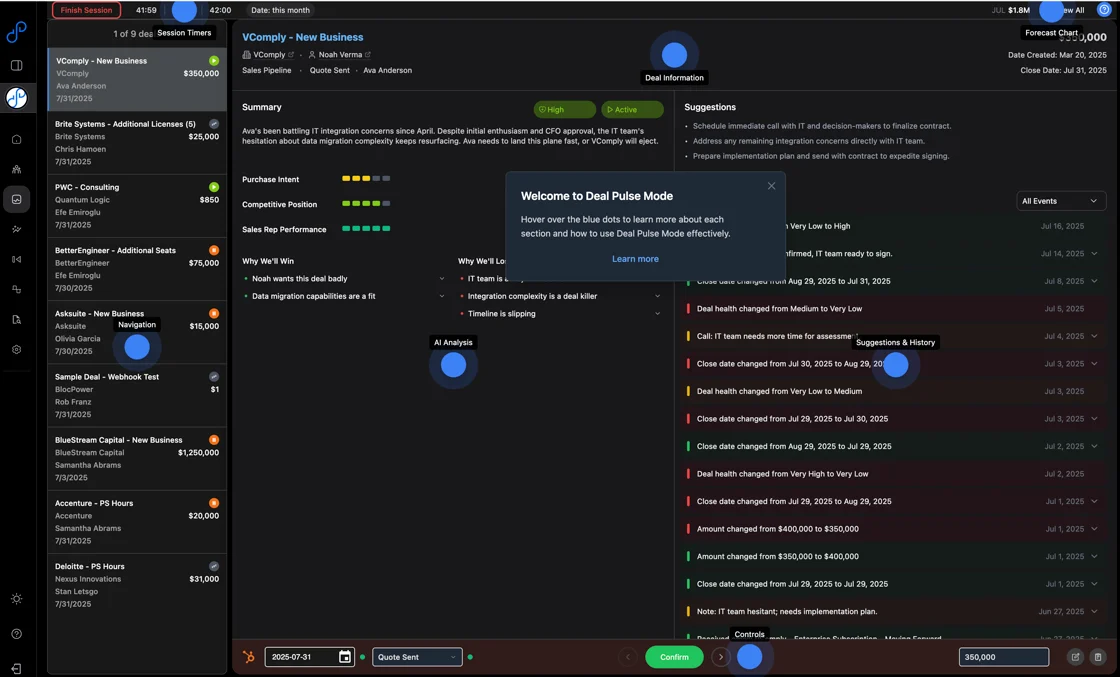
Deal Pulse Mode is powerful but can be overwhelming for new users. The new help overlay provides instant, contextual guidance without leaving your workflow.
Learn While You Work
The help overlay explains:
- What each section shows
- How to interpret the data
- Which actions are available
- Best practices for using each feature
No need to open documentation or watch training videos - help is right there when you need it.
Simple Activation
Access help instantly:
- Click the question mark icon in the top right
- Hover over any section for explanations
- Click close when done
The overlay doesn't interrupt your work - it enhances it with on-demand guidance.
Reduces Training Time
New users can:
- Self-serve learning without formal training
- Understand features in context
- Build confidence through exploration
- Get productive faster
Experienced users can quickly refresh on features they use less frequently.
Practical Applications
Monday Morning Reviews
Start the week with the Activity Dashboard:
- Filter to last week's activities
- Sort by meetings held to see execution
- Click low performers to see their specific activities
- Identify who needs coaching or support
Rep Performance Analysis
Dive deep into individual performance:
- Click a rep's name to filter everything
- View their activity trends over time
- Compare meetings booked vs held
- Analyze call connect rates and talk time
Deal Activity Tracking
Focus on deal-related activities:
- Filter to show only deal associations
- See which deals get the most attention
- Identify deals lacking engagement
- Spot patterns in successful deal activities
New User Onboarding
Accelerate Deal Pulse adoption:
- Have new users explore with help overlay active
- Let them learn features through discovery
- Build confidence with contextual guidance
- Reduce formal training requirements
Tips for Maximum Value
Activity Dashboard Best Practices
Daily Use: Check morning activity from yesterday to spot issues early.
Weekly Reviews: Monday analysis of previous week to set current week priorities.
Monthly Trends: First-of-month review to understand broader patterns.
Rep Coaching: Click individual reps during 1-on-1s to review their specific activities.
Deal Pulse Learning Path
Start Simple: Use help overlay to understand basic features first.
Build Complexity: Gradually explore advanced features as comfort grows.
Share Knowledge: Show team members useful features they might have missed.
Regular Refreshers: Re-enable help overlay periodically to discover new capabilities.
Getting Started
Activity Dashboard: Navigate to Team Activity Dashboard from the main menu. Start by viewing last week's data to understand your baseline.
Deal Pulse Help: Open Deal Pulse Mode and click the question mark icon. Hover over different sections to learn what they do.
Both features are designed for immediate value with no setup required. The Activity Dashboard shows your data instantly, while the help overlay is always one click away.
The Result
These updates make Data Parrot both more powerful and more accessible:
- The Activity Dashboard provides complete visibility into team performance
- Dynamic filtering makes data exploration natural
- The help overlay reduces the learning curve
- Together, they help teams get more value faster
Whether you're analyzing team performance or learning Deal Pulse features, these tools make the process smoother and more effective.
About the Author
Data Parrot Team
The Data Parrot Team
The Data Parrot team is dedicated to building the most advanced AI-powered sales intelligence platform. We're a group of engineers, data scientists, and revenue operations experts passionate about helping sales teams succeed.