Product Update: AI Forecast with Close Date Visualization
AI Forecast now shows deals by close date with purchase intent filtering, plus the export feature returns for all Data Parrot views.

Visualize Your Pipeline by Close Date
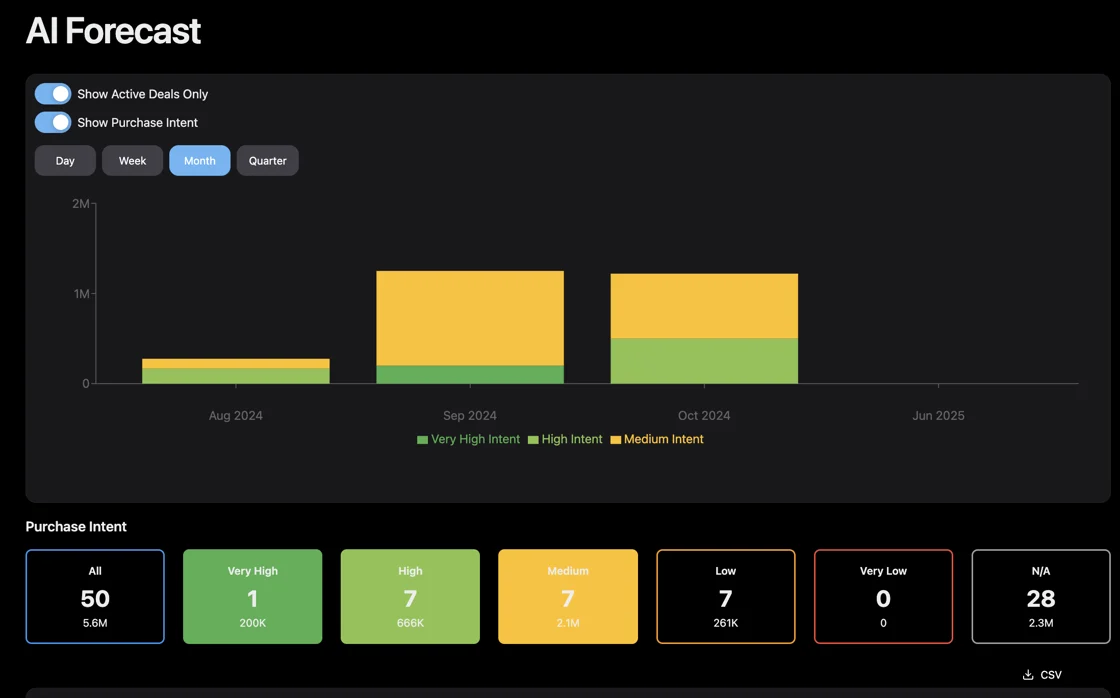
The AI Forecast section now includes a Deals by Close Date chart that helps you see exactly when revenue is expected to land. This timeline view combined with purchase intent scoring gives you a clearer picture of what's really going to close.

New Forecast Capabilities
Deals by Close Date Chart
See your entire pipeline spread across time. The new chart displays all your deals organized by their expected close dates, making it easy to spot gaps in your pipeline or periods where you're overcommitted.
Filter by Purchase Intent
Click the colored boxes (green, yellow, red) to filter deals by their purchase intent level. Want to see only high-intent deals closing this month? One click shows you exactly what's likely to convert.
Show Only Active Deals
Toggle "Show Active Deals" to hide stuck or dormant opportunities. This gives you a realistic view of deals that are actually progressing toward close, filtering out the noise of stalled opportunities.
Purchase Intent Breakdown
Select "Show Purchase Intent" to convert the chart into a stacked bar format. Now you can see not just the total value by close date, but how that value breaks down by likelihood to close. Green shows high intent, yellow shows medium, and red shows low intent deals.
Export Returns to Data Parrot

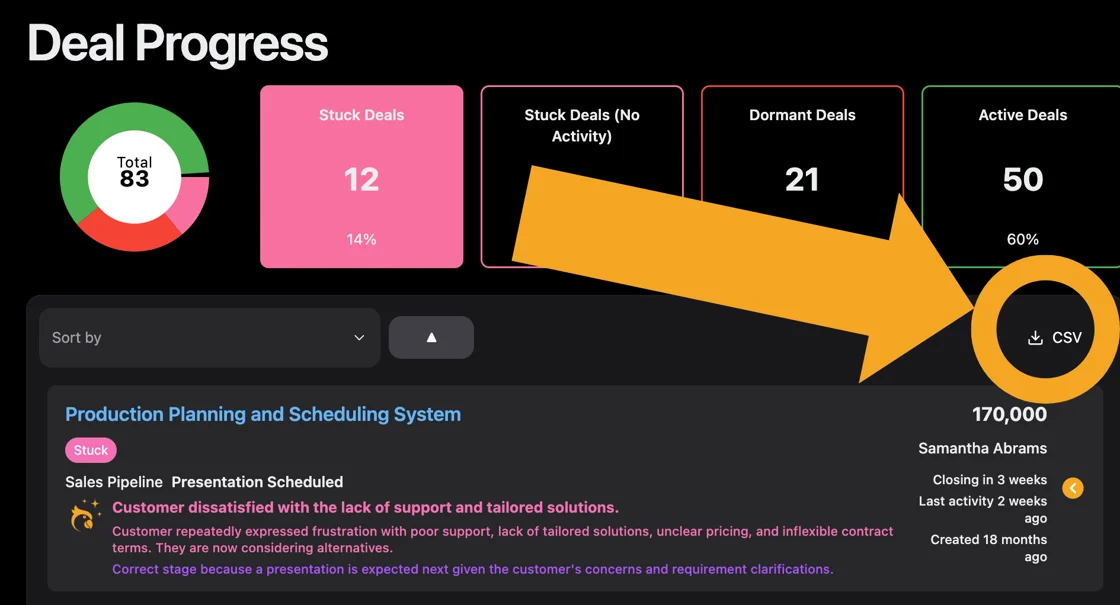
The export button is back! You can now export data from any view in Data Parrot:
- Export filtered results to share with your team
- Create custom reports in your preferred spreadsheet tool
- Archive snapshots of your pipeline at key moments
- Share specific insights with stakeholders who don't have Data Parrot access
The export feature works with all your current filters and views, so you get exactly the data you're looking at on screen.
Making Better Forecasts
These updates work together to give you more confidence in your forecast. Start by looking at the Deals by Close Date chart to understand your pipeline timeline. Then filter by purchase intent to see which deals are actually likely to close. Remove stuck and dormant deals to get a realistic picture.
The stacked bar view is particularly useful for forecast calls. You can show your team not just what's supposed to close, but the confidence level for each period based on actual buyer behavior and engagement.
Export the filtered view to create reports for leadership or to track how your forecast accuracy improves over time.
All features are available now in your Data Parrot account. The interface updates automatically, and your existing data flows seamlessly into the new visualizations.
About the Author
Data Parrot Team
The Data Parrot Team
The Data Parrot team is dedicated to building the most advanced AI-powered sales intelligence platform. We're a group of engineers, data scientists, and revenue operations experts passionate about helping sales teams succeed.